PicoLog6 - Software for the data loggers from Pico Technology
Getting started with PicoLog6 - Part 1
Getting started with PicoLog6 - Part 2
Getting started with PicoLog6 - Part 3
Overview
PicoLog 6 is a complete data acquisition software package. It provides a visual, easy-to-use interface for users to quickly set up simple or complex acquisitions, record, view and analyze data.
- Real-time data collection and display
- Visual logger and channel setup for easy configuration and viewing
- Available for Windows 7, 8 and 10 (32 and 64-bit), macOS and Linux
- Virtually unlimited logging capacity to PC
- Robust database format minimizes data loss and corruption
- Simple and complex programmable alarms
- Channels can be scaled using lookup table or equation
- Up to 4 independent graph axes
- Data can be exported as CSV, clipboard image and PDF
- Supports multiple different PicoLog data loggers and PicoScope oscilloscopes on the same PC
- Download PicoLog 6 now for free, from https://www.picotech.com/download.
Straightforward from the start
Designed from the ground up to be intuitive from the outset, PicoLog 6 allows you to set up the logger and start recording with just a few clicks of the mouse, whatever your level of data logging experience.
From here, starting a capture is simple: plug in the logger, add a channel, press Record, and you’re logging! PicoLog 6 also includes a number of additional features to cater for more advanced data logging needs.
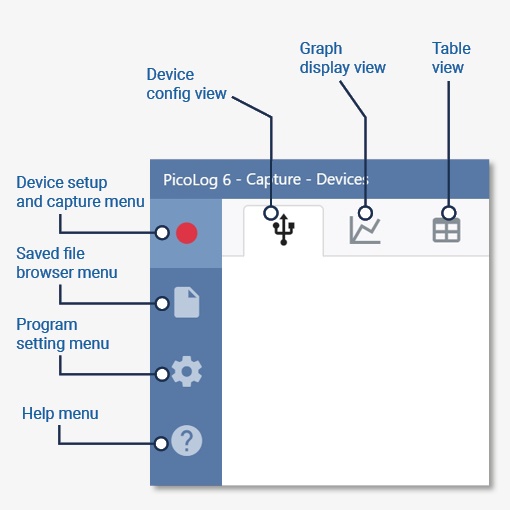
Easy navigation
A simple vertical menu bar on the left of the screen provides permanent access to the main program menus and view modes of PicoLog 6 without pausing capture. The permanent vertical navigation bar gives access to the following menus:
- Device setup and capture menu
- Saved file browser menu
- Program settings menu
- Help menu
The device setup and capture menu
Within the Device setup and capture menu are Device configuration view, Graph view and Table view providing a visually smart way to set up and acquire data from a multichannel acquisition system, even with multiple different PicoLog data loggers and PicoScope oscilloscopes with hundreds of channels enabled and logging.

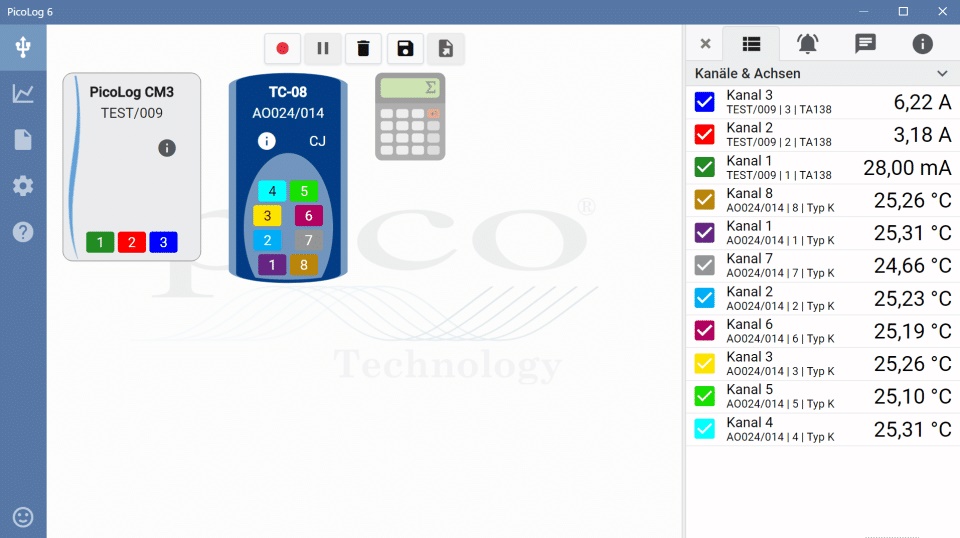
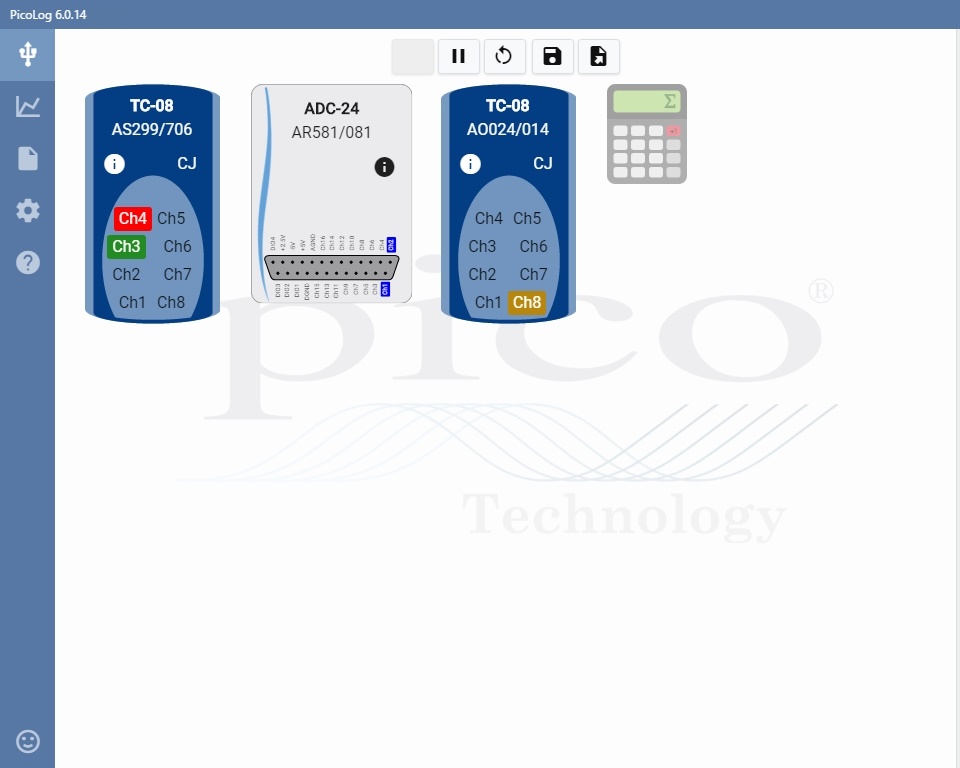
Device configuration
In the Device configuration view you can instantly see the status of instruments, acquisition channel setting and math channel setup. An image of the device appears for each device detected, showing which channels are enabled. Device configurations can simply be moved or copied to aid larger multi-instrument configurations, swap out devices during capture or share configurations.
From this screen you can view and adjust settings such as adding graph axes, per-channel scaling factor, alarms, notes, graph annotations, channel naming and color, sample mode and sample interval.

View live numerical data in table format
Table view is a really useful new feature which allows you to view your tabulated numerical data in a spreadsheet format. Table view is not only available to view live data from your current dataset, you can also view tabulated data in your saved data files.
When configuring table view, it is possible to add 4 statistical parameters to each channel, choose from; last sample, minimum, maximum and average. In addition, the output sample rate must be specified allowing you to define the frequency that table rows are calculated.
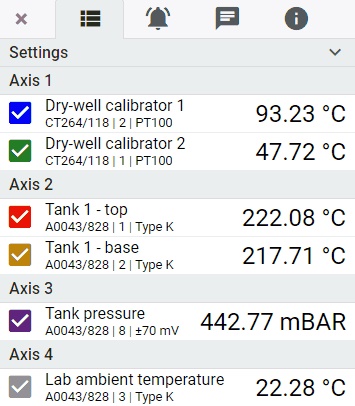
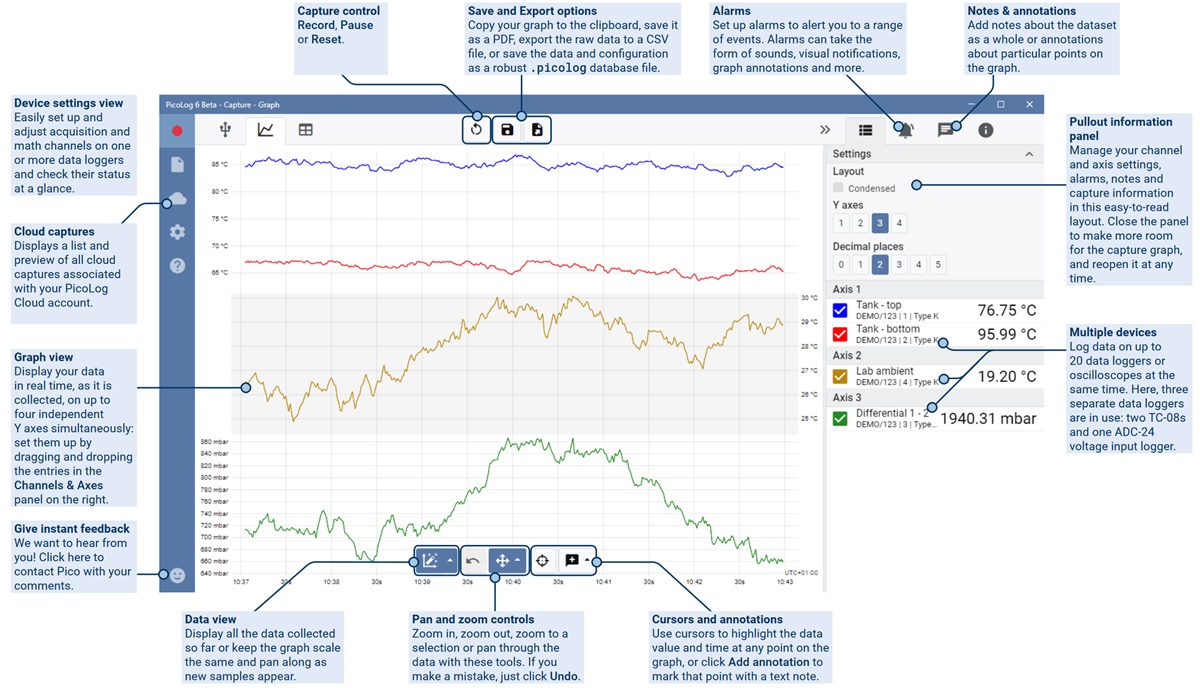
Setting up Channels and Axes
The Channel and Axes settings menu is visible in both the Device settings and Capture Graph views. Once a channel is enabled and settings confirmed, you can view its connection status at a glance, along with alarm condition and current live measurement. In this menu, you can also configure alarms and view graph annotations and capture info.
Exporting data
When you’re ready to export the data, you have several options. First, save the .picolog file and close the acquisition. You can save files with custom search tags to make them easier to categorize and locate later.
Exporting large datasets to CSV can often be troublesome due to file size limitations, so PicoLog 6 includes a suite of export options to narrow down the size of the whole dataset. These include downsampling, selecting channels to export or even restricting the export region to the zoomed area on screen.
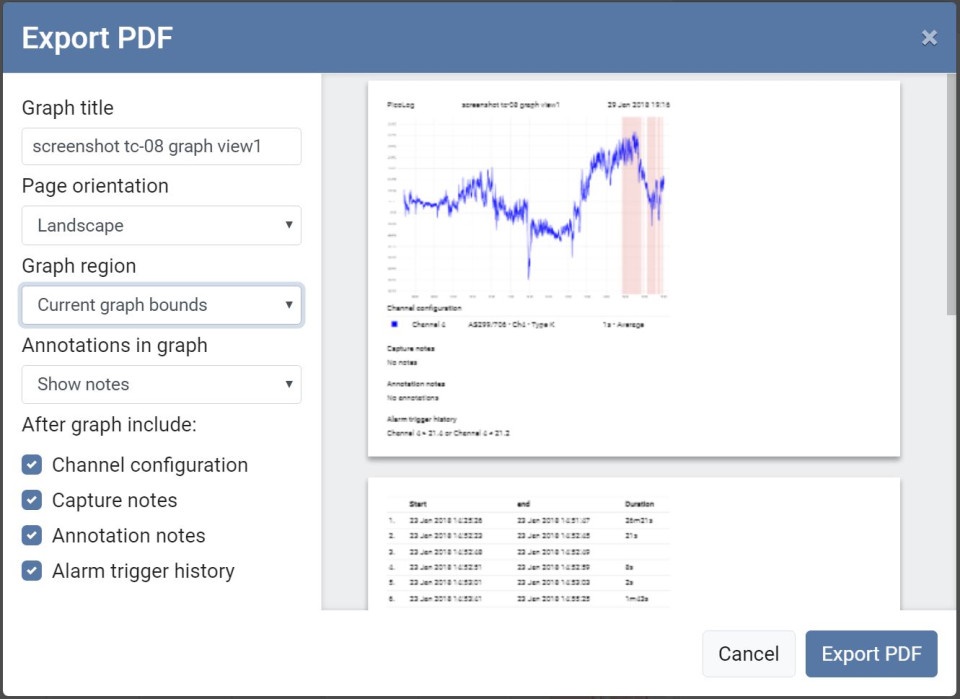
Want to export a screen shot? PicoLog 6 includes a feature to export the graph as a PDF: again, select either the entire capture or the zoomed area of interest. The export to PDF format also includes options to include alarm trigger history, annotations, channel configuration and capture notes, for a complete capture report.